Visualization Playbook
Run this playbook to load compiled outputs, build charts, work with spatial layers, and export analysis products.
Document Control
| Field | Value |
|---|---|
| Author | Geraldson Muluh |
| Owner | GCBM Assistant maintainers |
| Audience | Analysts and reporting users |
| Last reviewed | 2026-03-27 |
| Review cadence | Monthly |
Prerequisites
- A compiled database exists from the Compilation playbook.
- If using spatial mode, TIFF outputs exist in
processed_output/spatial/.
Inputs Required
- Compiled SQLite database file
- Optional spatial output directory
- Desired chart configuration (indicator, chart type, filters)
Procedure
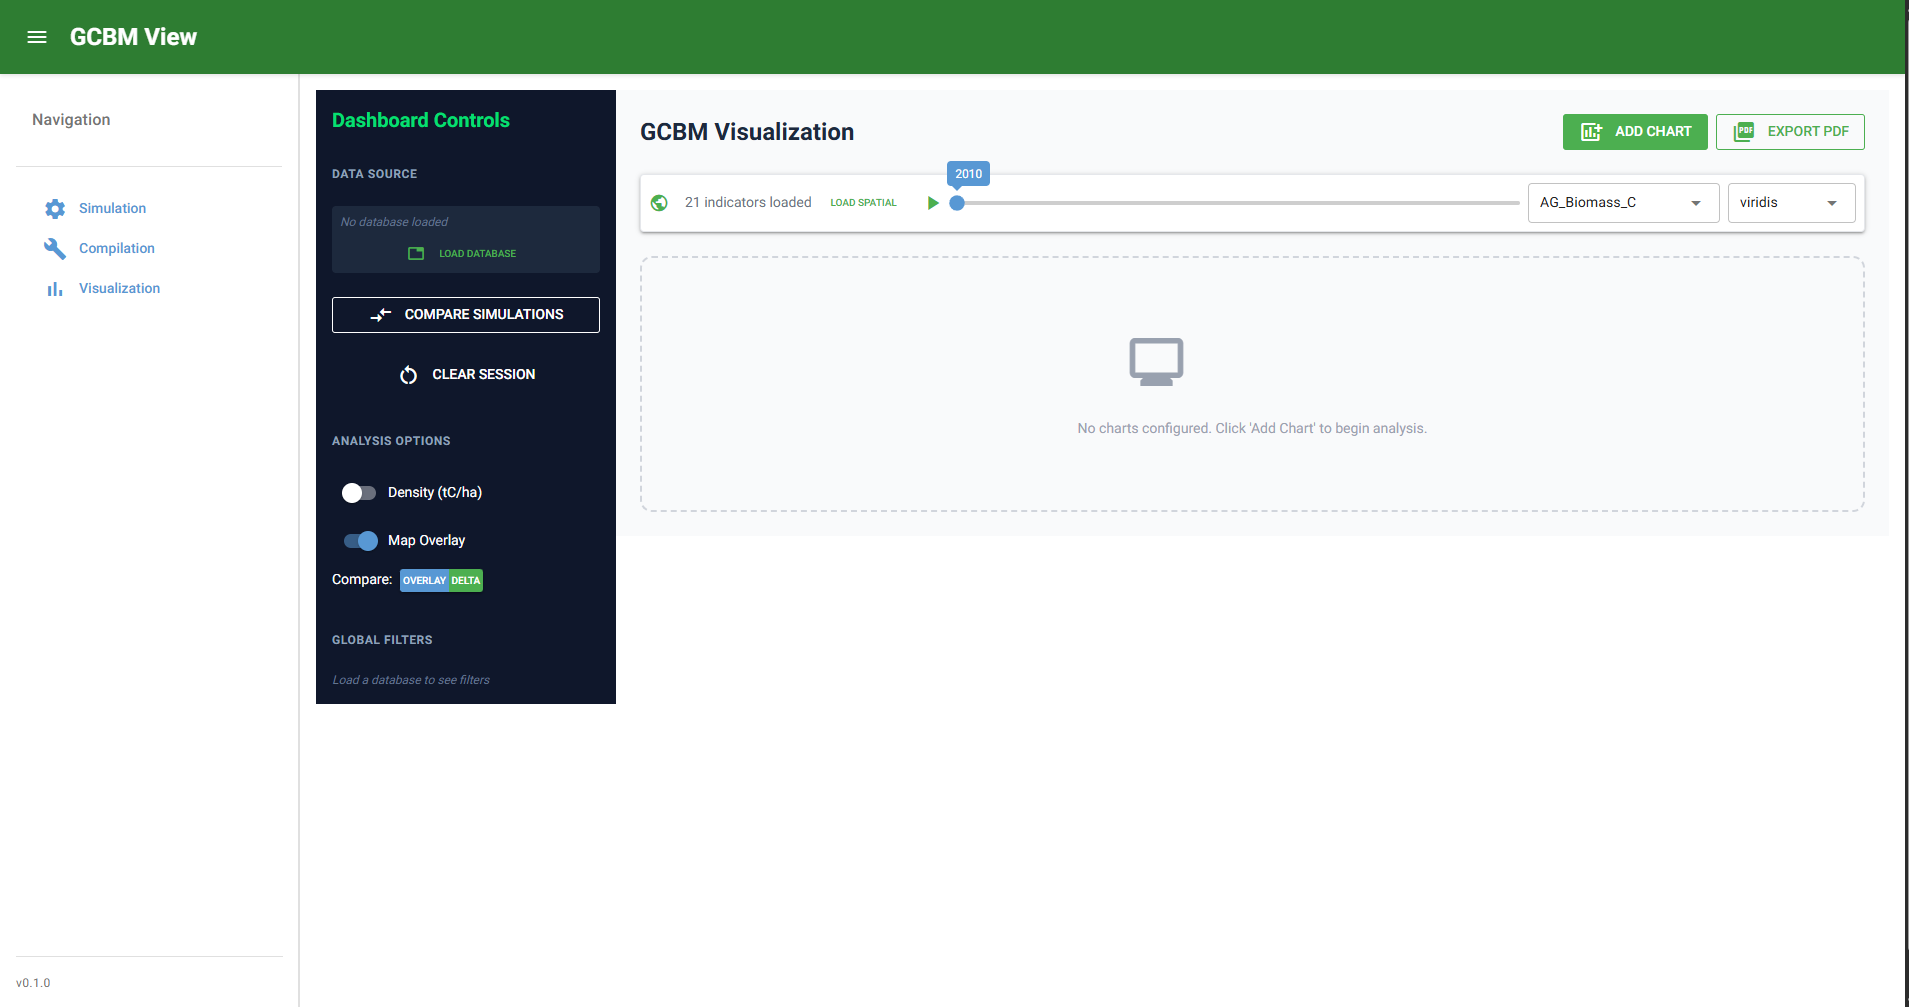
Step 1: Load Compiled Database
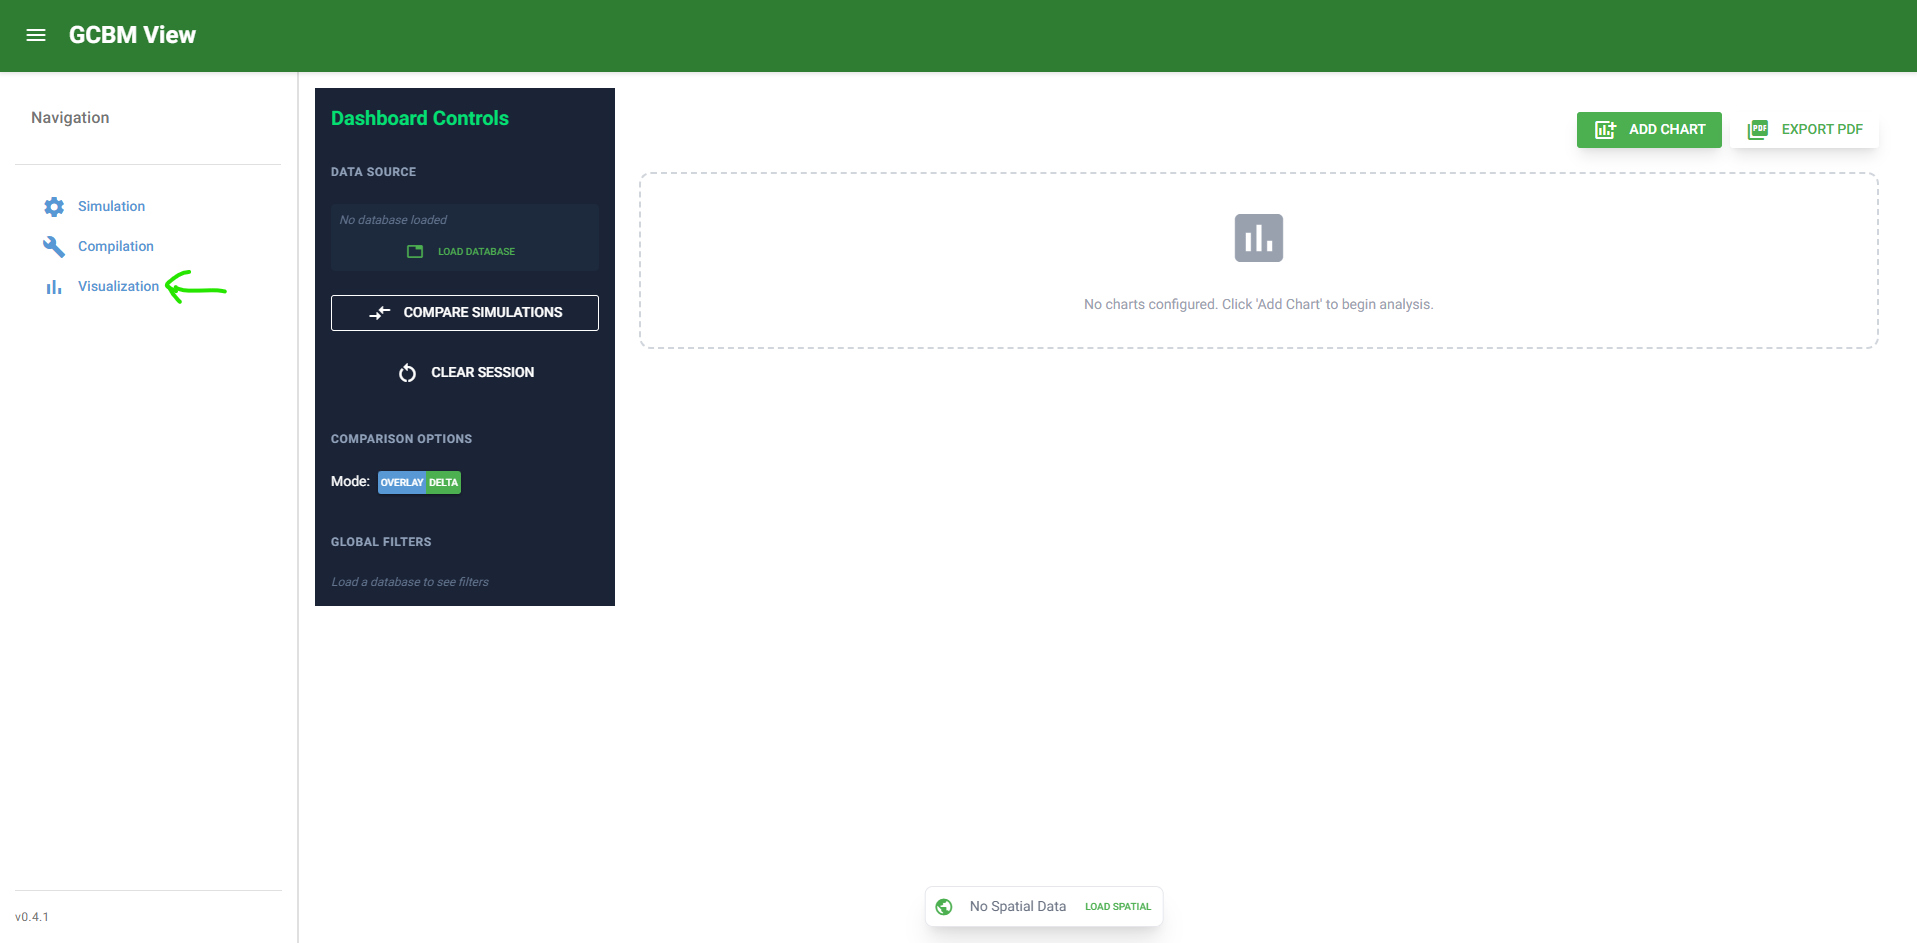
- Open Visualize.
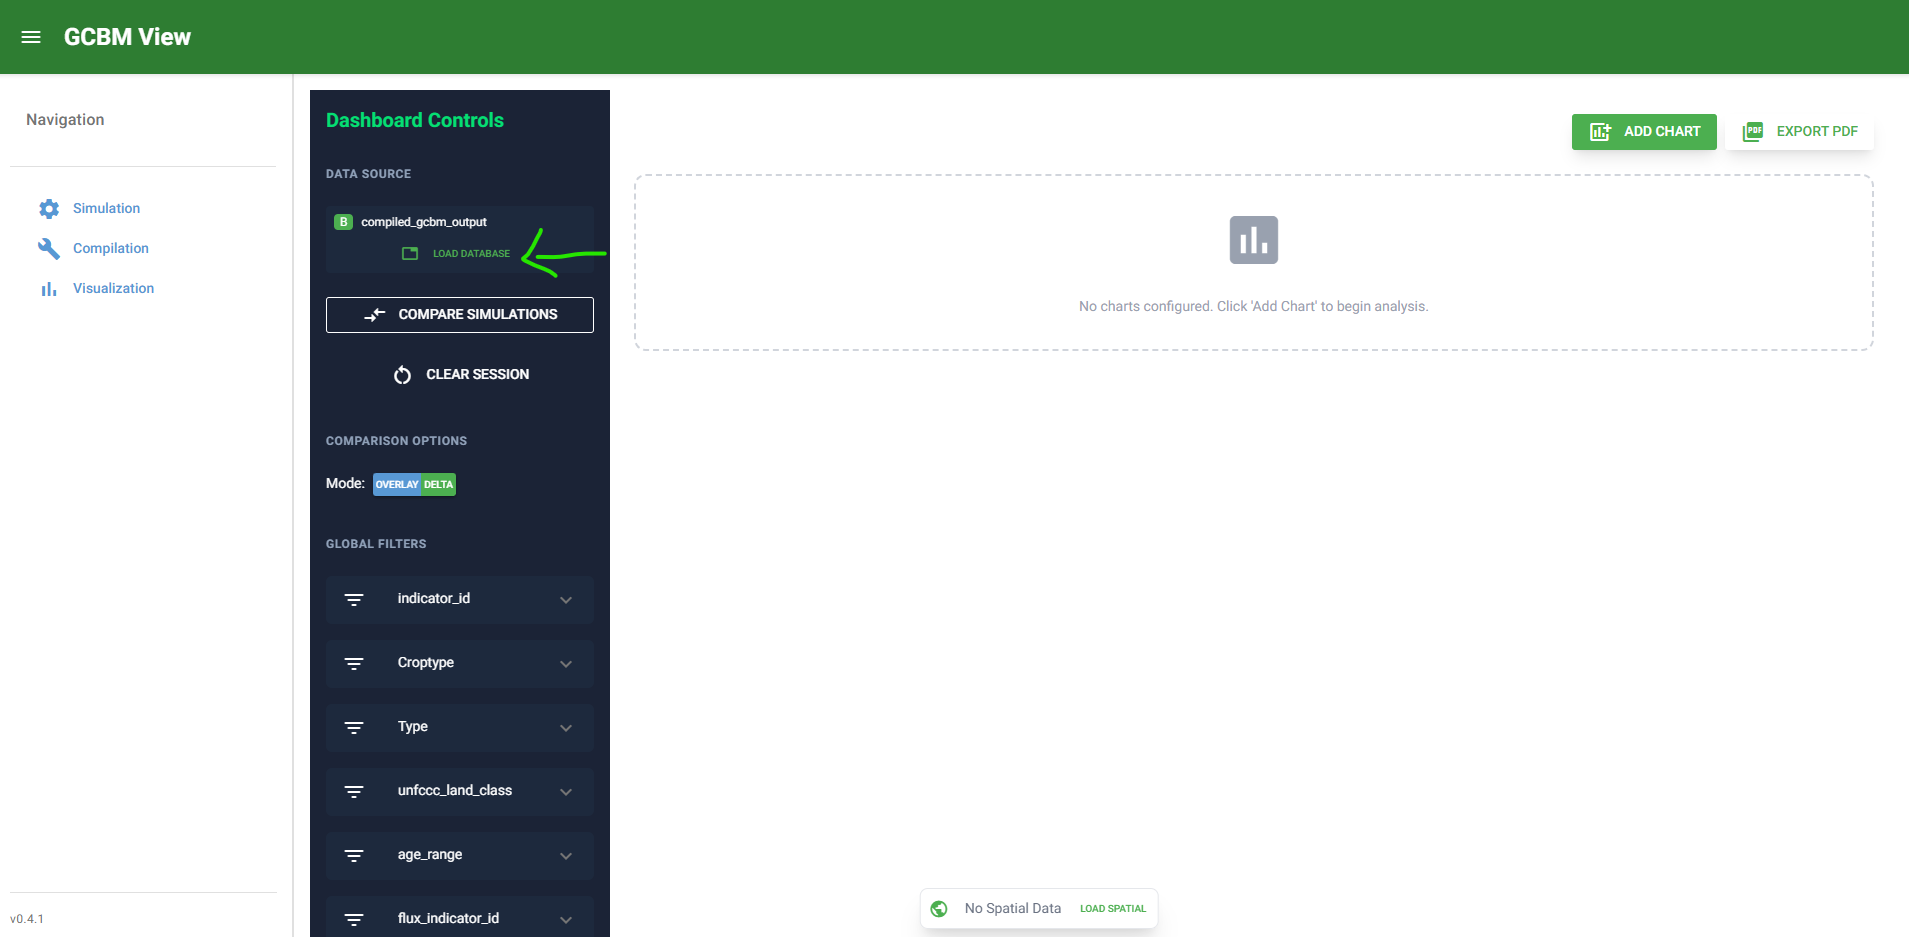
- Select compiled database file.
- Confirm data load succeeds.
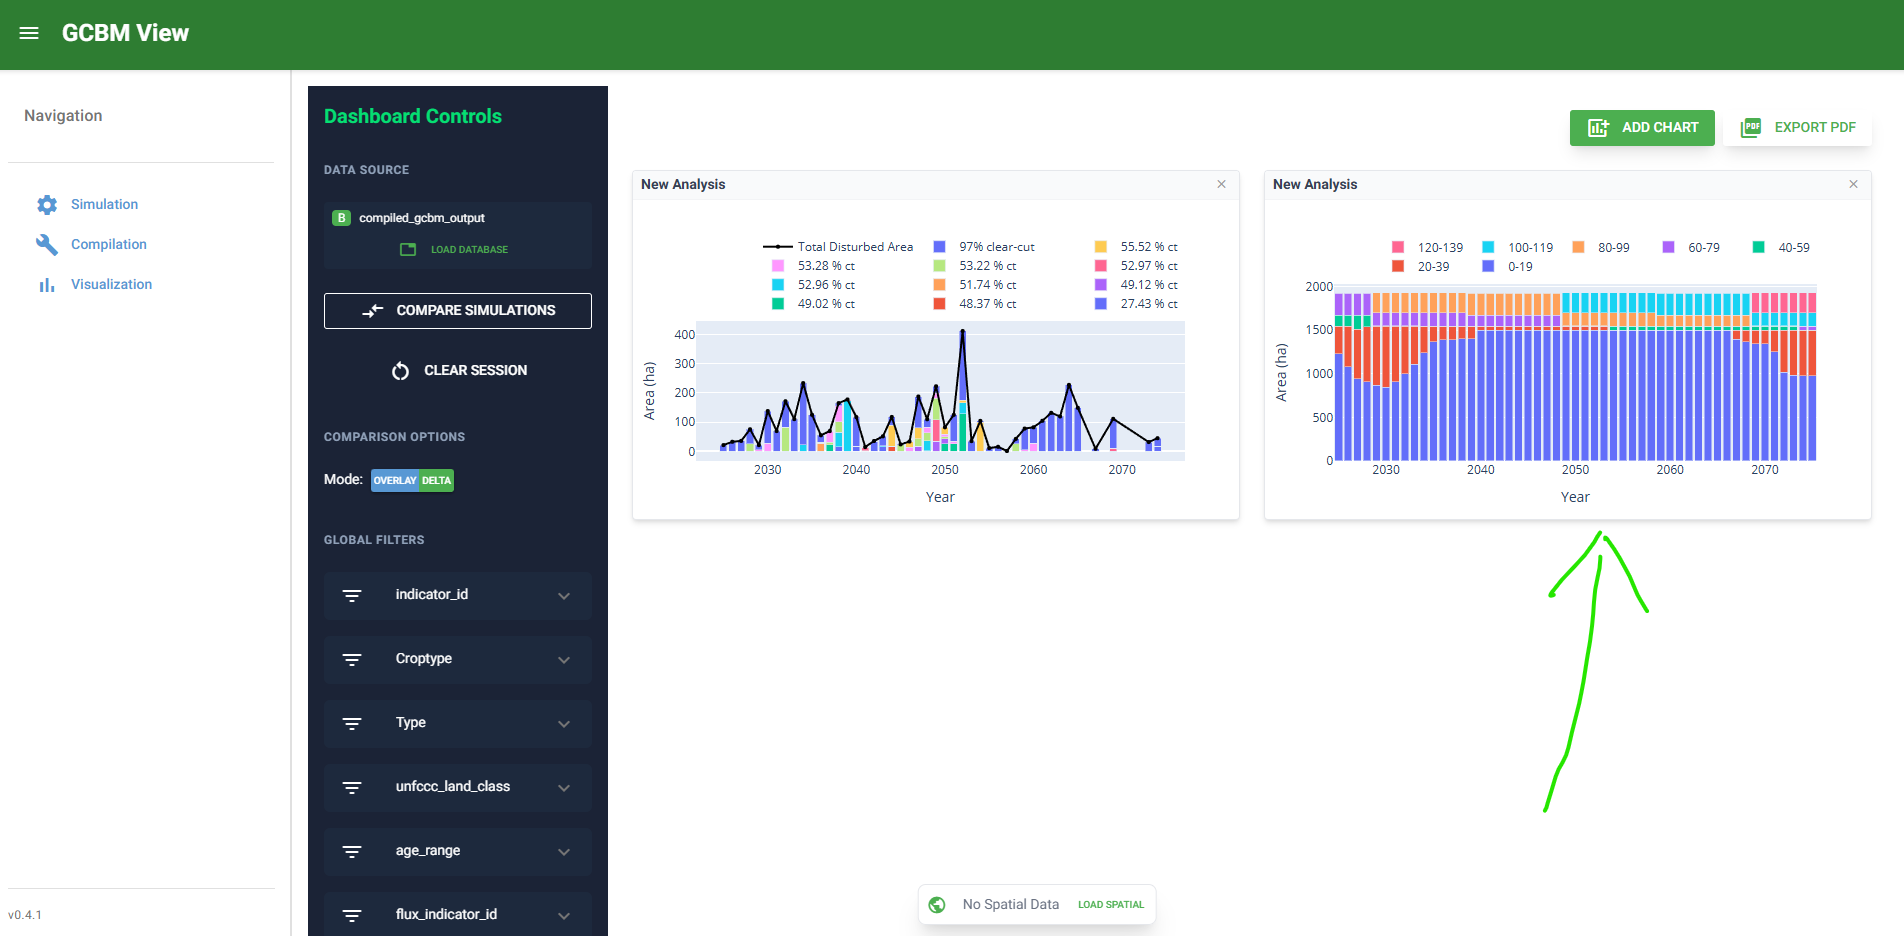
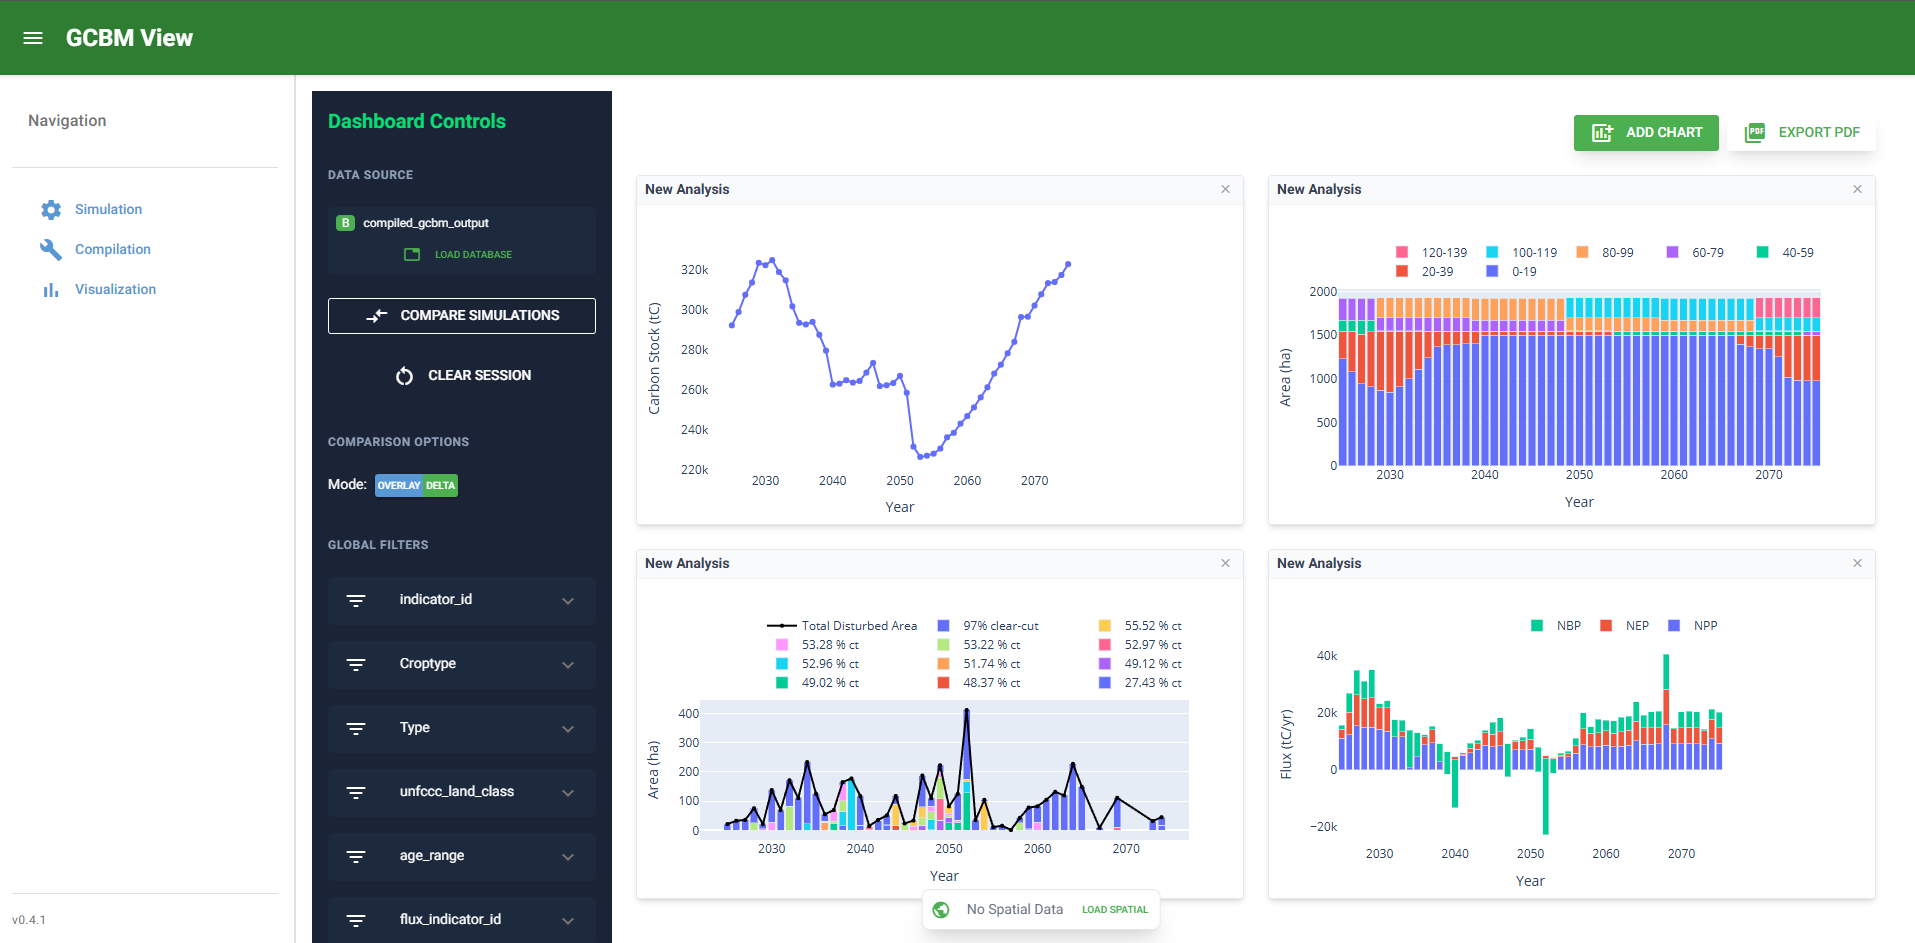
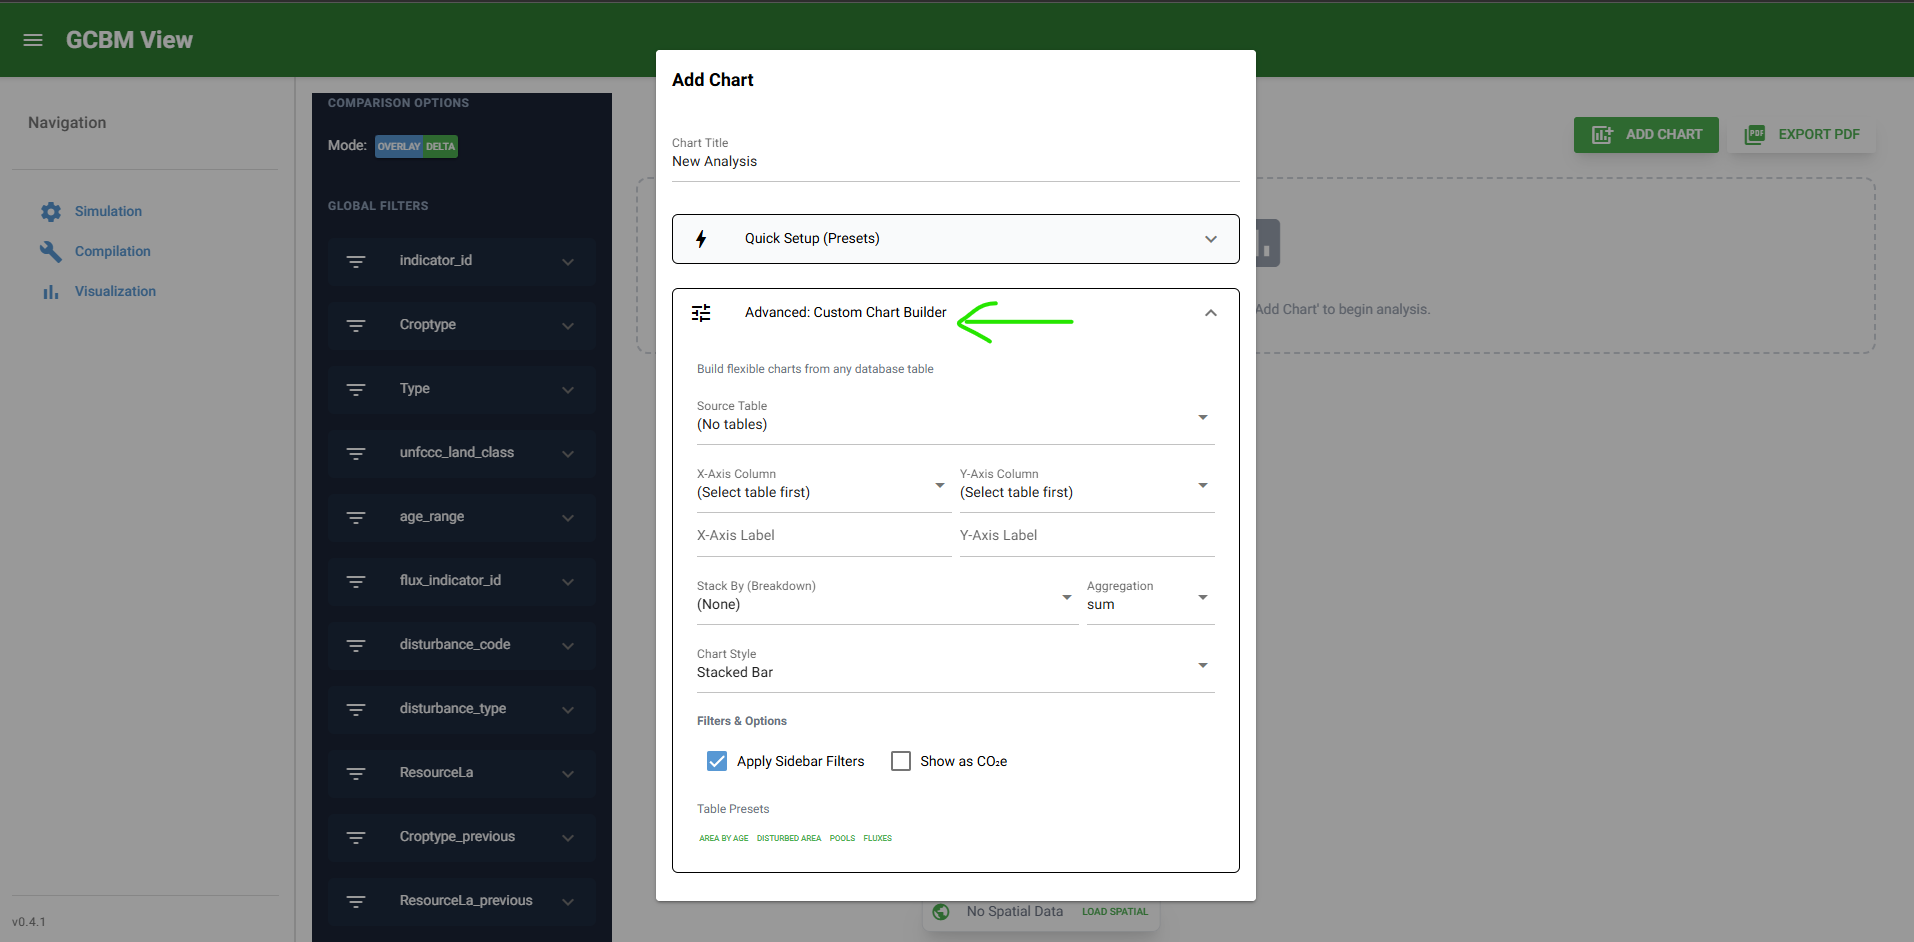
Step 2: Add Charts
- Click Add Chart.
- Choose chart type and indicator presets.
- Apply classifier filters as needed.
Step 3: Use Spatial Controls (Optional)
- Click Load Spatial and select spatial output folder.
- Pick indicator and colormap.
- Use year slider and playback controls to inspect temporal changes.
Step 4: Export and Share
- Export chart snapshots or PDFs as required.
- Capture run context and filters used for reporting.
Expected Outputs
- Interactive charts loaded from compiled DB
- Spatial map rendering for TIFF-backed indicators
- Exported chart/report artifacts where selected
Validation Checks
- At least one chart renders with expected data.
- Classifier filters update charts consistently.
- Spatial map loads and responds to year changes.
- Exported outputs are generated and readable.
Failure Modes and Recovery
| Failure mode | Typical cause | Recovery |
|---|---|---|
| Charts do not render | Invalid DB path or missing views | Reload correct DB and confirm compiled views exist |
| Spatial controls show no data | No TIFF outputs or wrong folder | Re-select spatial folder or recompile with TIFF output |
| Playback fails or map looks stale | Cached map mismatch after data change | Reload spatial directory to rebuild map cache |
Run Specifics and Auditability Checklist
Record these items for analysis sessions:
- Database filename and path
- Spatial folder path (if used)
- Indicator(s), filters, and year range used in visuals
- Exported file names and destinations
- Any known caveat observed during interpretation
Advanced Reference Links
Optional Video Aids
Video walkthroughs are optional support assets. Core operation should remain fully covered by this written playbook and screenshots.
Example Spatial and Chart Context